InTDS ArchivebyVladimir ZhyvovFrom Default Python Line Chart to Journal-Quality InfographicsTransform boring default Matplotlib line charts into stunning, customized visualizationsDec 30, 202420Dec 30, 202420
InTowards DevbyPy-Core Python ProgrammingBuilding a Real-Time System Monitoring Dashboard with PythonLet’s create a dashboard using Python that monitors your system’s performance in real-time. The dashboard will display your PC’s RAM, CPU…Oct 2, 20248Oct 2, 20248
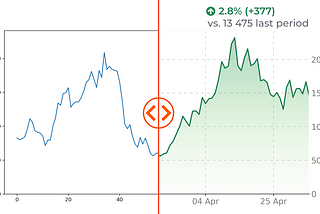
Ritesh Shergill📊📈Creating Amazing Visualizations with PythonA picture is worth a thousand wordsAug 17, 202412Aug 17, 202412
InLevel Up CodingbyOm KamathHow I Built A Beautiful Web App Purely in Python — with Zero Experience.Using FastAPI, Jinja2 and DaisyUI.May 19, 202412May 19, 202412
InGoogle Cloud - CommunitybyOm KamathDid Google Just Kill Streamlit?Checking out Google’s Mesop Framework to see if it’s better than Streamlit.Jun 25, 202433Jun 25, 202433
InTDS ArchivebyNaveen VenkatesanIntro to Dynamic Visualization with Python — Animations and Interactive PlotsMaking basic animations and interactive plots with PythonApr 26, 20204Apr 26, 20204
InTDS ArchivebyMaarten GrootendorstQuickly Build and Deploy an Application with StreamlitDeploying your Streamlit application to Heroku to showcase your Data SolutionNov 11, 20196Nov 11, 20196